Quick introduction to debugging golang application with gdb.
I have spent most of my time coding in Delphi and .Net with has fantastic IDEs and debugging capabilities.
When I shifted to Golang I was debugging code by putting a detailed log, untill I learned to use gdb. This post is all about providing a consise steps so as to start using gdb. One can find detailed explanations at golang/gdb and Gnu debugger
Before I move ahead let me borrow statement from golang website which reads “….the instructions below should be taken only as a guide to how to use GDB when it works, not as a guarantee of success.” and known issue and limitations
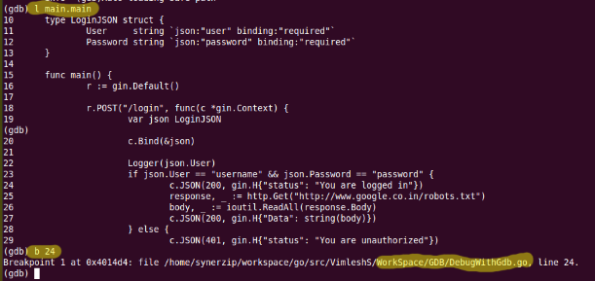
For a sake a simplicity and demo purpose I’m choosing a small web application developed in gin-gonic as below
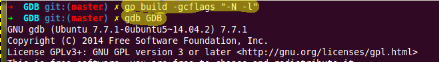
How to build go code
go build -gcflags "-N -l"
This option prevents the compiler to optimize go-code and helps in debugging with gdb
Few command operations
- To list a function or file use “list”/”l”
- This works well either with function name or line number
- To set a breakpoint use “break”/”b”
- This also works well either with function name or line number
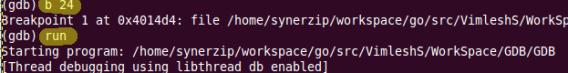
- To starts a program use “run”
- To executes next line use “next”/”n”
- To prints value of expression use “print”/”p”
Start debugging in 4 steps
Step 1 Build program with the flag provided at the top and launch gdb debugger
Step 2 “list” the code portion if that is required or set directly break point
Step 3 Now start the debugger to begin with debugging
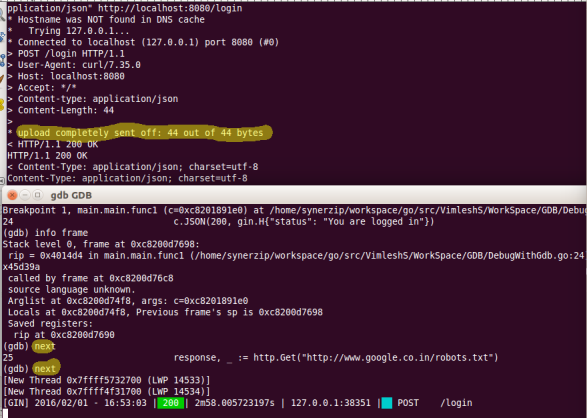
Step 4 I have used curl to post a request to web server
curl -iv -XPOST -d'{"User": "username", "Password": "password"}' -H"Content-type: application/json" http://localhost:8080/login
In second half of screen, execution has paused at the break point, use “next”/”step” or “continue” what ever is your desired debugging choice